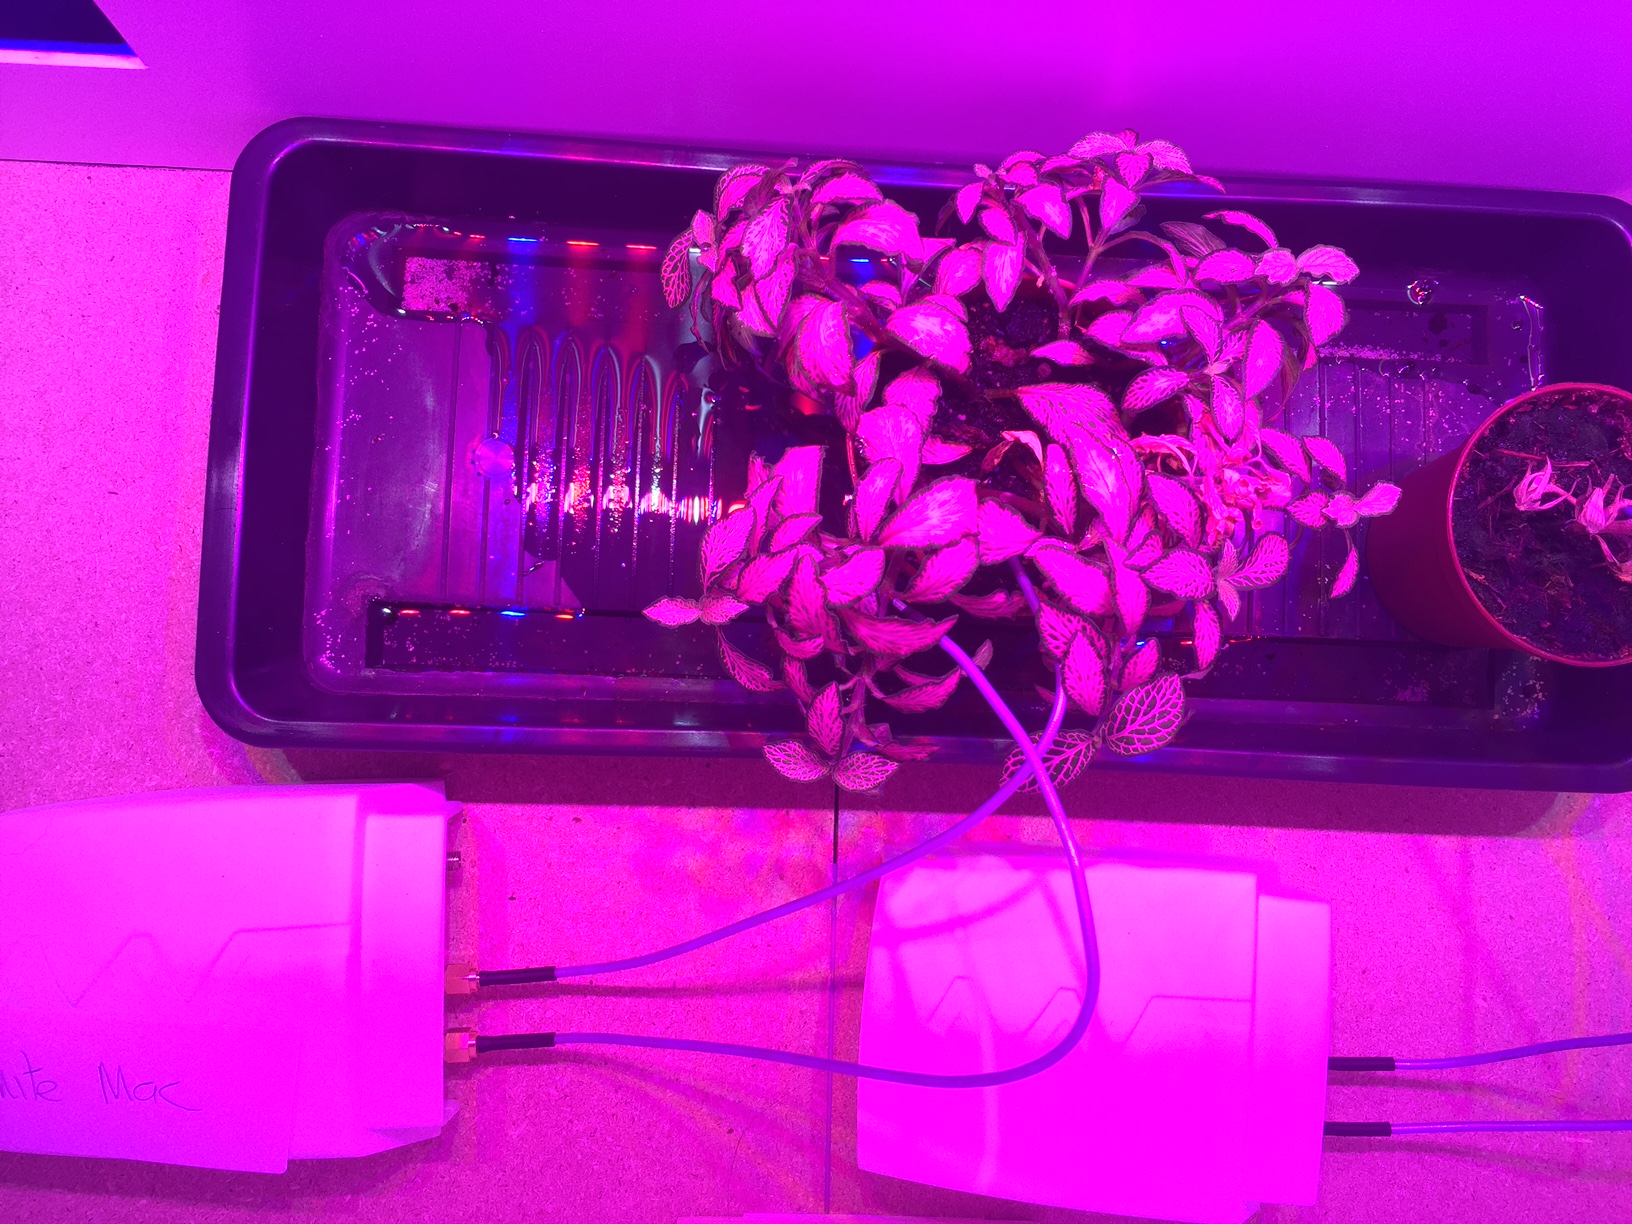
Over the last few weeks here at Phytl Signs we have been focusing on running some long-term experiments monitoring variations in electrical signals in plants. We have recorded electrical signals from 3 plants in different ambient conditions over the last month. We are delighted with how much we have learned about the set up of this type of experiment and would be pleased to hear from other people interested in this experimental technique.
Shown below are graphs from the last 10 days or so showing voltage variations over time. There are plainly obvious differences at the macro-level between these results. These are interesting in themselves.
But we can also see, when we examine these data in detail, that the experiments have hundreds of common features. It really is fascinating.
We are now working hard on processing the data. For this work we sampled at 1000 samples per second so we have generated huge amounts of data. We’ve chosen to do this as we are interested in fast transient signals (durations less than 2 seconds) as well as the longer term variations you can see in these graphs.
If you are a data scientist or computational biologist and would like to learn more about we are doing or collaborate with us we be delighted to speak with you.
We will be presenting these and other experimental results at a seminar at the University of Lausanne on October 27th and are looking forward to discussing next steps.
NATURAL LIGHT
CONTINUOUS ARTIFICIAL LIGHT
ARTIFICIAL LIGHT 17 HOUR DAY
If you are interested in plant physiology, electrical signalling in plants or signal and data processing we are looking for collaborators and would be happy to hear from you. You can email us at research@phytlsigns.com
We will post some more of our findings in the coming weeks.


